System Dynamics
System dynamics is a simulation modeling language for understanding the behavior of complex dynamic systems. Invented by Jay Forrester of MIT in the mid-1950s, the basic language models the feedback loop structure of a system by using nodes (stocks, constants, and variables), relationships between nodes (arrows), table functions (a type of constant), and time delays. System dynamics implementations such as Vensim add features like graphs, subscripting, Monte Carlo sensitivity testing, and database lookups. System dynamics is particularly well suited to modeling difficult social problems like sustainability. A sample model and its output graph are shown below.

This is about the simplest model possible. The two nodes of Population and birth rate form a feedback loop. The third node, fractional birth rate, is a constant. Population is what's called a "stock" so it's a box. Like the way a bathtub works, a stock accumulates what flows into it minus what flows out of it. In this case there is only a flow into Population, the straight arrow. The little valve icon is a rate, It equals Population times the fractional birth rate.
For the simulation run shown the initial Population was 10 and the fractional birth rate was 1%. The run ran for 500 years. The graph shows how exponential growth caused Population to grow slowly at first, and then accelerate and run off the graph. This is similar to what's happened to global population.
More complex models are capable of modeling the essential features of any problem. They all work the same. Nodes are arranged into feedback loops to form the important structure of the system. Since the way that structure behaves over time is easily simulated, system dynamics can give the modeler powerful insights, quickly and at low cost.
Good system dynamics models are such a close approximation of reality that system dynamics modeling has achieved great success in a number of difficult problem areas, including business, the American urban decay problem of the 1960s, epidemiology, ecology, and environmental sustainability. It's most famous application was The Limits to Growth project and book in 1972. Here's the key graphical output from the first edition of Limits to Growth:

This was the graph that shocked a sleeping world into realizing it had a new, rather large problem.
The above graph incorporated data up to 1970. Everything after that was a rough prediction. How well did these predictions bear out?
We now have data up to 2010. The graph below, prepared from a later version of this article on Looking Back on the Limits to Growth, shows the prediction was amazingly close.

Why system dynamics is important
What do you do when a problem has stumped the world's experts for over thirty years? How to you approach a problem that defies normal problem solving methods?
It very simple. You use tools that can cut through the fog of complexity.
System dynamics is one such tool. It's great at smashing through counter intuitive system behavior. It's the simplest simulation modeling tool available that's capable of handling the sustainability problem. This simplicity allows anyone to inspect the model to see how it works. It also allows serious problem solvers to learn the tool, which depending on your abilities takes anywhere from a few days to a few months.
The biggest thing system dynamics does is reveal the hidden structure that's causing a tricky problem. Any tool that can do this is a near miracle, which is just what environmentalists need.
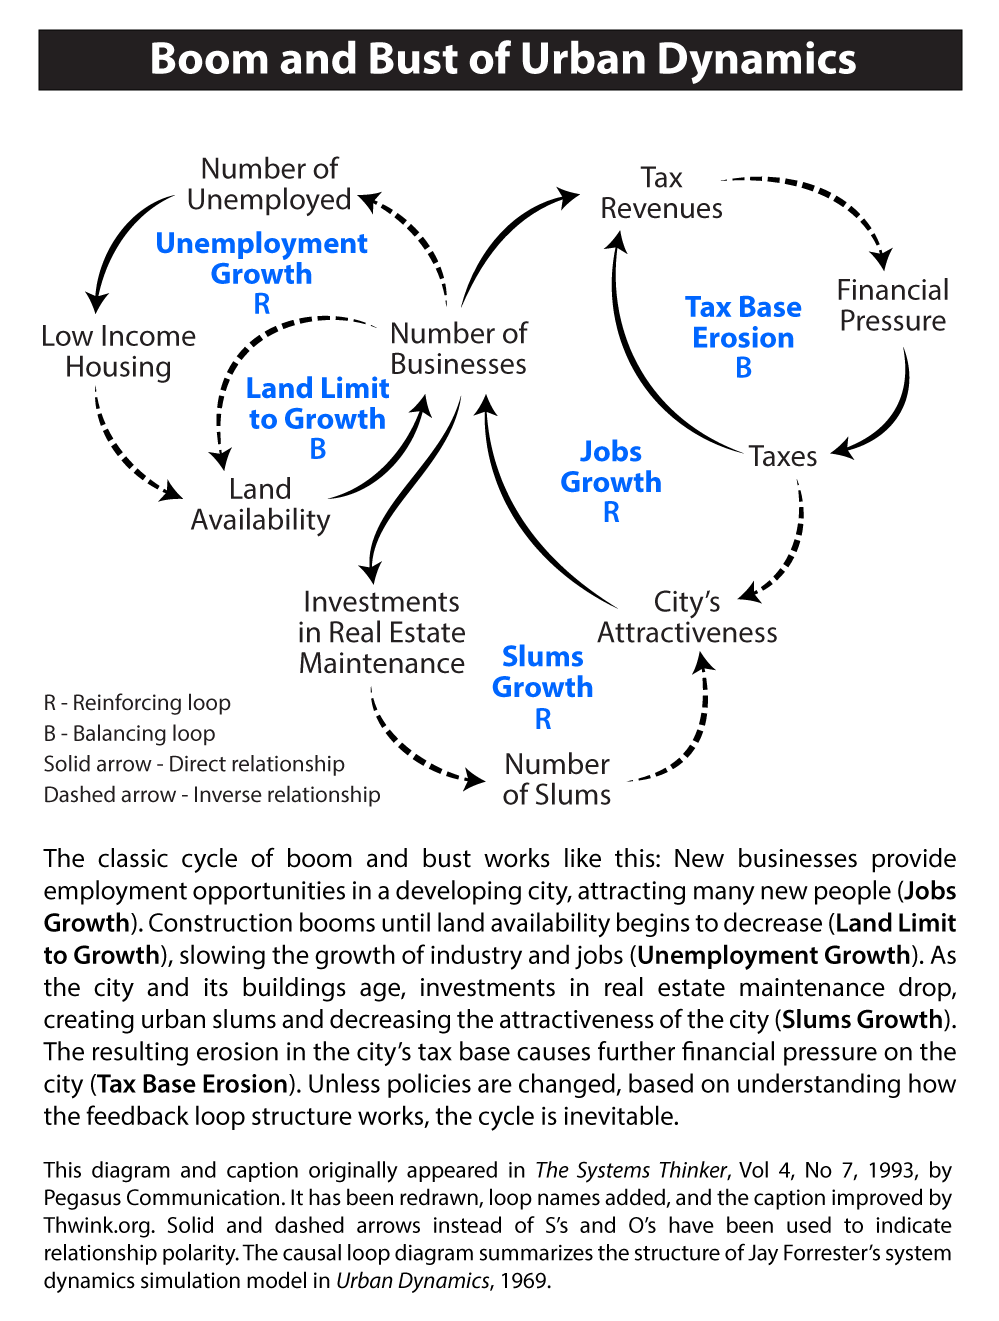
Jay Forrester's Urban Dynamics book and model
One of the most influential models in the history of system dynamics was published by Jay Forrester in his classic work, Urban Dynamics, 1969. The book stunned academics, city managers, neighborhood leaders, etc, with its conclusion that the four most popular solutions to the United States urban decay problem were ineffective. This was a highly counterintuitive finding, but it was irrefutable due to the sound construction of the model. This was the book that put system dynamics on the map.
The most popular solution, low cost housing, was the worst of all for two reasons: (1) Low cost housing took up land that could have been used to build businesses. This reduced the number of jobs available. (2) Low cost housing attracted people from outside the city, which increased joblessness.
Here's what the basic model looks like:
A detailed example of how this tool can be applied
The diagram below shows an actual simulation model from the Dueling Loops paper. This model was used to find the root cause of high systemic change resistance to solving the sustainability problem. Then the high leverage points for resolving the root cause were found, as shown on the model. Along the way the low leverage points were found. These are powerful conclusions and show how system dynamics modeling can lead to swift solution of a problem.

Let's discuss the model in a little more depth.
The above model is a hypothesis of what is causing the very strong change resistance the environmental movement has encountered in solving the sustainability problem, as well as the wall of change resistance progressives have run up against in solving problems whose solution would benefit the common good of all.
According to the structure of the model, politicians are locked in a battle of the race to the bottom versus the race to the top. Whichever loop gathers the most supporters (voters) wins. Supporters are infected by false memes (self-serving deception) in the race to the bottom and true memes (the objective truth for the good of all) in the race to the top.
Once the structure of a social system becomes visible, we can start to glean a number of insights. For example, a huge insight in the above model is the fact that the size of a false meme can be inflated, but the size of the truth cannot. This is because a corrupt politician can promise voters far more than he can or intends to deliver, but a virtuous politician cannot. There are many more types of deception that works just as well, like false enemies, pushing the fear hot button, and wrong priorities. Thus for the same amount of effort a corrupt politician can gather many more supporters than a virtuous politician can. This gives the race to the bottom a large inherent structural advantage over the race to the top. As a result the race to the bottom is the the dominant loop, which is why corruption in politics is the norm and it so impossibly hard to stamp out.
The inherent structural advantage of the race to the bottom also explains why special interests like corporations have been able to so easily control political decisions, such as resistance to environmental regulations. All corporations have to do is donate enough money (or other forms of coercion) to the right corrupt politicians, and they will do anything the corporations want, within reason, because if they don't the money will go to someone else and the politician will not get elected or reelected. In other words, the most corrupt politician is the winner. This explains why the upper loop is named the race to the bottom.
An even more important insight is there are two high leverage points in this structure. These are underlined. One in particular is quite potent, according to the simulation runs. This is the general ability to detect political deception. Currently this is low, about 20%, which causes detected false memes to be low. But if the general ability to detect political deception can be raised to a high level, say to 80%, then detected false memes becomes large. This in turn causes repulsion memes to grow large and undetected false memes to become small. The result is the degenerates infectivity rate drops like a stone and the rationalists infectivity rate soars like a dove, which causes the Supporters Due to Degeneration stock to fall and Supporters Due to Rationality to grow. The end result is loop dominance flips from the race to the bottom to the race to the top. The system will then respond correctly to the truth about the global environmental sustainability problem because it will now be in the best interests of the virtuous politicians in charge.
This model demonstrates why system dynamics is such a powerful tool. It exposes the structure of the problem to the light of day. Without such knowledge, sustainability problem solvers are forced to fall back on educated guesses on what the real causes of the problem are, which, as we have seen for the last 30 years, have missed the mark.


