Causal Loop Diagram (CLD)
Contents
Introduction to causal loop diagramming
The high-level CLD for the World3 model
How to create CLDs for non-trivial problems
A causal loop diagram (CLD) explains the behavior of a system by showing a collection of connected nodes and the feedback loops created by the connections. One or more of the nodes represent the symptoms of the problem. The rest of the nodes are the causal chains causing the problem.
The simplest possible CLD contains two nodes. Below is an example from video 3 in The Dueling Loops Video Series. The R signifies this is a reinforcing loop. The graph shows the loop's general behavior by showing the symptom of interest, population growth.

The insight is that problem symptoms are caused by certain key feedback loops. It follows that to solve a complex system problem you must first model its key feedback loops.
Now take a look at the same causal loop diagram transferred to a system dynamics simulation model.
Introduction to causal loop diagramming
All you need to draw CLDs is pencil and paper or a whiteboard. Below is an actual sketch of a CLD from my notebook on October 20, 2004. On the next notebook page this became The Race to the Bottom loop in the first version of the Dueling Loops model. (A solid arrow is a direct relationship. A dashed arrow is an inverse relationship.)

Let's walk the reinforcing loop, denoted by an “R.” As fallaciousness of arguments goes up, so does false attacks and false promises. As these increase, so does supporters due to falsehood. That in turn causes an increase in political power due to falsehood. Since the strategy of mass deception worked so well, that in turn increases the next round of fallaciousness of arguments and the loop starts all over again. Loop growth creates a social force. This loop increases the force of mass deception in the political powerplace. Note this force does not arise from individual nodes. It comes from the feedback loop. That is the key insight offered by causal loop diagramming. The tool allows you to find where the fundamental forces causing a problem are coming from.
Here's how causal loop diagramming works. A CLD consists of nodes, arrows, and feedback loops. The nodes on the one above are truth ratings, detected deception, false attacks, false promises, and so on. A node has a name and a value and represents something in the real world. What matters is not the exact value, but the value relative to what it was earlier or in relation to other nodes.
There are two types of arrows for showing how one node influences another. A solid arrow is a direct relationship, where the value of node A varies directly with the value of node B. A dashed arrow indicates an inverse relationship, where as the value of A goes up the value of B goes down, or vice versa.
There are two types of feedback loops: reinforcing and balancing. In a reinforcing feedback loop (designated R) a change in a node goes around the loop to cause a change in that same node in the same direction, which causes the loop to grow or decline. In a balancing feedback loop (designated B) the change is in the opposite direction, which causes the loop to balance its behavior as it seeks a goal of some kind.
The high-level CLD for the World3 model
Below is probably the most famous CLD in existence. It's the high-level diagram of how the World3 model of The Limits to Growth works. (1972, page 97) Here is the more detailed high-level model, from the book describing the technical detail of the World3 model, Dynamics of Growth in a Finite World, 1974, p14.
Instead of Rs or Bs for loops, (+) and (-) are used. The lower left loop has a "(+)" in it. That's a positive or reinforcing loop. The book emphasized this loop, named Industrial Growth, was the key feedback loop pushing the human system beyond the limits of growth, and thus toward eventual collapse unless the sustainability problem was proactively solved.
Let's examine how this loop works. An increase in investment causes growth in industrial capital. Growth in that causes growth in industrial output. As output grows, more money is directed toward investment, and the loop starts over again. In this manner the Industrial Growth loop rapidly grows to huge amounts.
The environmental sustainability problem arises from the way growth in industrial output causes more pollution (as well as decreasing nonrenewable and renewable resources, not shown). The effect of pollution has a long delay, so there is no reason to solve the problem now in the minds of many people. It is only enlightened minds, those educated by insights from models like this, that can see the future before it happens and decide to commit to solving the problem proactively.
Wouldn't it be nice if a majority of the world's population could grasp the truth of this model and decide to aggressively solve the sustainability problem?
That is currently impossible due to high systemic change resistance.
How to create CLDs for non-trivial problems
Here's a simple process for doing this. First you structure your work by accumulating this information first, before you start drawing a CLD:
1. Model name, like The Vicious Cycle of Car Congestion in Cities.
2. The key output variables you want the model to explain, like Road Capacity and Congestion, and further description as necessary. Here capacity is in percent. 90% would be very congested. At 100% cars would be packed so closely together (touching) average speed would be zero. Congestion means low average car speed.
3. Problem symptoms. This describes the present behavior of the key output variables and describes the problem to solve. For example, Congestion remains subbornly high, even though plenty of Road Capacity has been built.
4. Dynamic hypothesis. Describe why the behavior of interest occurs in terms of feedback loops. Here the dynamic hypothesis is that when investment causes Road Capacity to increase, Congestion falls. But this attracts more cars. In a few years, Congestion and low average car speed are right back where they were before. This causes demand for more roads to reduce Congestion. A vicious cycle has occurred.
5. A list of the factors that probably must be in the model, given your knowledge of the problem. These might be Number of Cars and Investment in Road Capacity.
6. A list of factors that might be necessary, such as Public Pressure for More Road Capacity, City Area, Population, and so on.
Now you have a well-structured problem. How to create a CLD is now much easier, since the above steps essentially define your CLD Requirements. Try the steps below as you draw on paper, in a modeling tool such as Vensim (recommended, try their free Vensim PLE), or in a diagramming tool such as Visio or Kumu.
The steps below for how to turn your requirements into a CLD are about the same as the steps for building a system dynamics model. The main differences are in addition to logical testing, you can use simulation testing, and each node has an equation.
1. Add the model name at the top.
2. Add the key output variables.
3. If there are causal relationships between any of these variables, add the arrows.
4. Now the hard part of synthesis begins. Tell yourself or those working with you a story of how the model works. What causes what? In particular, root cause analysis tells use to ask "Why does this occur?" Use your answers and the story to start adding nodes and connecting them to the nodes already on the model. Your list of factors should be useful here. Each node must have a carefully chosen name that clearly describes what it represents. Don't be afraid of long names.
5. As you add or change arrows, always identify the arrow as a direct or inverse relationship. In a direct relationship, a change in node A causes a change in node B in the same direction. In an indirect relationship, a change in node A causes a change in node B in the opposite direction. I personally prefer solid lines for direct and dashed lines for indirect. Others use + for direct and - for indirect. Include a delay mark on an arrow as necessary.
6. If you are thinking ahead to a systems dynamics model, it helps to identify the stocks as early as possible, since they are usually the backbone of the model. Indicate stocks with rectangles. Add the main stocks to the model as early as you can. Things that exist when a model is not running are stocks, such as Population and Number of Cars.
7. Continue and strive to get your first feedback loop created as soon as possible. Now walk the loop all the way around. Tell a story of how each node influences the next node. Verify the loop makes sense. Determine if it's a reinforcing or balancing loop. Give the loop a carefully chosen name, one that describes the main effect of the loop. Add the loop name and a symbol for reinforcing or balancing (R or B). Arrange the arrows to give the loop a rounded, smooth shape.
8. Iterate with steps 4 through 7 until done. Strive for a well-organized model that's easy to read.
Now suppose we built the CLD for The Vicious Cycle of Car Congestion in Cities using the above process. The result might look like this:

We've made some changes from the variable names we wrote down earlier, in order to arrive at a diagram that made sense. Road Capacity is a city's road system, so it's a stock. Number of Cars could also be a stock, but to keep things simple it's not. The key to the model is the two loops.
Starting at Congestion Percent, as congestion goes up, people put pressure on their local government for more road capacity. Plus the government puts pressure on themselves to keep their citizens happy. This pressure increase Road Investment, which after a delay increases Road Capacity.
Now the model gets interesting. The increase in capacity causes two things. One is it causes congestion to go DOWN. This inverse relationship is shown by the dashed arrow, and creates the balancing loop of More Road Capacity. The second result is that as capacity goes up, Number of Cars also goes up. More people who were not commuting via car before now switch to cars. This causes congestion to go UP and creates the More Cars reinforcing loop. The result is Pressure for More Road Capacity also goes up, and the More Road Capacity loop starts all over again. The two loops form the Fixes that Fail pattern.
Turning a CLD into a system dynamics model
Next, if we converted the CLD into a system dynamics model using Vensim, we might get one that looks like this:

We had to add nodes to turn the CLD into a system dynamics model. There were 5 nodes in the CLD but 18 in the system dynamics model, which contains much more detail.
The three turquoise nodes are lookup tables. These are used to calculate the effect of one variable on another, using a curve. The model is running, so you can see the sliders for the eight constants. These can be adjusted to change the graphs in real time. Calibrating the model to an actual city would require measured data for the contants and graphs of actual behavior for the lookup tables.
Because of the delay the behavior is cyclic. The vicious cycle is never escaped, causing Road Capacity to continually overshoot and come back down. This causes a ripple effect on the other variables.
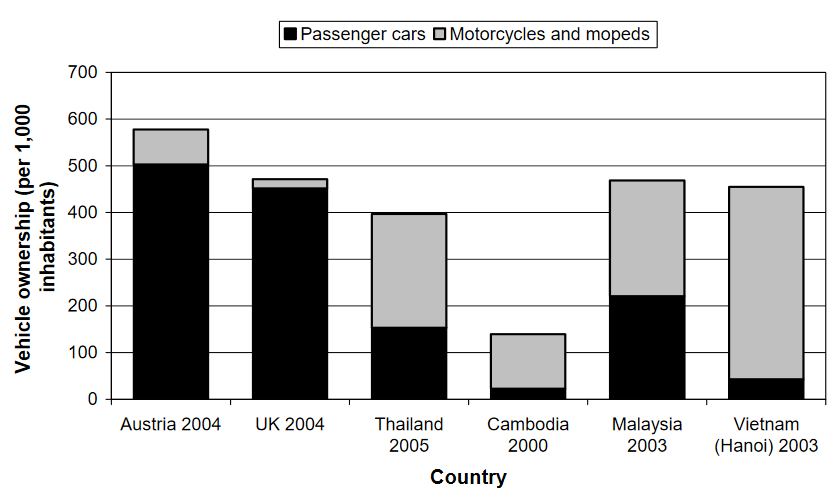
The dynamic hypothesis of a vicious cycle was confirmed. The insight is that the conventional solution of build more roads to reduce congestion doesn't work. Some other solution strategy must be used instead. One way to begin to find these solutions would be to expand the model using root cause analysis. Why do people choose cars instead of other forms of transport? We can ask inspect-the-system questions like: Why in some countries do people vastly prefer motorcycles and mopeds to cars? See the graph below. (source, page 25)
Issue 1. Inspection - Note that inspection of the CLD cannot reveal if cyclic behavior would occur or not. The delay might cause only slow adjustment to addition of more Road Capacity. Or it might cause cyclic behavior. Nor could inspection of the CLD tell how long the cycles might be. Here they are about 35 years apart. How does that relate to a delay of only 10 years? You cannot tell from the CLD. You could also look at the CLD and ask: An increase in Road Capacity causes congestion to go UP if you travel one arrrow, but it causes congestion to go DOWN if you travel the other arrow. Why don't these cancel each other out and cause no change in congestion? The CLD offers no clue to this puzzle, while the system dynamics model explains this easily. It's because of the 4 factors used to calculate Number of Cars, in addition to Road Capacity.
The structural cause of the overshoot cycles is identical to many other cases of overshoot. Overshoot cycles are common. For example, Jared Diamond, in Collapse How Societies Choose to Fail or Succeed, 2005, page 546, reported that:
"Ancient Greece went through cycles of environmental problems and re-covery, at intervals of about 400 years. In each cycle, human population built up, forests were cut down, hillsides were terraced to reduce erosion, and dams were built to minimize siltation in the valley bottoms. Eventually in each cycle, the terraces and dams became overwhelmed, and the region had to be abandoned or suffered a drastic decrease in population and in societal complexity, until the landscape had recovered sufficiently to permit a further population buildup."
Issue 2. Hidden flaws - As you create a CLD it helps tremendously to think ahead to the system dynamics model it will or could become. This avoids the error of a CLD that intuitively makes sense to the average person, but to a modeler (and by comparison to the real world) has flaws. It's impossible or impractical for some reason. For example, Food causes Population to grow but no Population Limit is included. Nothing can grow forever, so it's an impossible model. If it's a trivial model, limits can be omitted.
Issue 3. Missing key concept - Or a key concept could be missing. For example, if more Congestion causes Road Capacity to increase, how does that actually occur? There's a missing node(s). It should be something like more Congestion causes Public Pressure for More Road Capacity causes Road Investment causes Road Capacity to increase. It's okay to omit concepts that don't matter much, like contants and intermediate variables. It's very hard to tell if a key concept is missing in a CLD, because a CLD lacks equations and the ability to simulate the behavior of the model, in order to test to see if the model's behavior agrees with the real world.
The limitations of causal loop diagrams
Issues 1, 2, and 3 above illustrate some of the limitations of CLDs compared to system dynamics modeling. There are many more. In general, CLDs should not be relied on for deep correct insights to how difficult problems behave. At most they can generate some possibly correct insights. The more difficult and complex the problem, the less likely these insights are to be complete and correct. This issue is examined in a 2001 paper on Maps and models in system dynamics: a response to Coyle. It's main point is:
"Our purpose in this paper is to review the roles of qualitative maps [CLDs] and simulation models in system dynamics, and to argue that simulation — following established system dynamics methodology — can add value beyond mapping [CLDs] alone in most cases. This argument rests upon two points that have been demonstrated repeatedly in the laboratory and in real life: first, that one cannot reliably draw inferences from complex causal maps without simulation and, second, that system dynamics is well suited for addressing issues associated with soft variables and incomplete data."
Hard and soft variables refer to the constants and lookup tables in a model, as well as variables calculated by the model, such as the way people's lifespans change. Hard variables are things that are easily measured and for which data is available. "Soft variables, in contrast, are those for which numerical metrics and data are not available, including factors such as goals, perceptions, and expectations." (Quote from John Sterman's Business Dynamics: Systems Thinking and Modeling for a Complex World, 2000, page 853.)
If a CLD represents a high-level view of a system dynamics model, then it doesn't have to be fully correct, since it's an architecture model. It shows the main pieces of the model and their relationships. Large system dynamics models require high-level models for their structure to be understood, such as the high-level CLD for the World3 model shown above.
 This is


