Social Force Diagrams
Contents
How Social Force Diagrams Work
Simple Example - The My Car Won't Start Problem
Retrospective Example - The Autocratic Ruler Problem
Retrospective Example - The Recurring Wars in Europe Problem
Current Example - The Money in Politics Problem
Introduction
Social Force Diagrams are a simple but powerful diagramming tool for solving difficult social system problems using root cause analysis. A Social Force Diagram shows the key forces causing a social system problem from a root cause analysis point of view.
Social Force Diagrams reduce confusing complexity to clear simplicity by organizing the key forces causing a social problem into a standard diagram format, using a standard vocabulary of terms. This standardization makes it much easier to find a difficult problem's causal structure. The standard diagram format is shown below.

How Social Force Diagrams Work
Like the way physical problems are caused by physical forces like gravity and momentum, social problems are causes by social forces. Social Force Diagrams organize the forces into three main types: Root Cause Forces (R), Superficial Solution Forces (S), and Fundamental Solution Forces (F).
The Law of Root Causes tells us that all causal problems arise from their root causes. Root cause forces are represented by the left blue block arrow. Once this force is understood, you have found the root causes.
But finding those root causes is not easy in difficult social problems due to system complexity. To make correct root cause analysis easier, Social Force Diagrams divide a problem into two layers: the superficial layer, which is easy to see, and the fundamental layer, which is hard to see.
Superficial Layer - First you use analyze the superficial layer to determine what the Superficial Solution Forces are. This is relatively easy because you already know what the symptoms and the superficial solutions are. Superficial solutions are the solutions that have been failing to solve the problem, because they were designed to solve the intermediate causes. Unless the laws of physics change, this will never work. Given that information, finding the low leverage points and intermediate causes follows fairly easily.
Fundamental Layer - Once you get this far, you have an important clue for how to dig deeper and penetrate to the fundamental layer. What is the deeper cause of the intermediate causes? That will lead to the root causes. From there you can determine the high leverage points that, which pushed on, will resolve the root causes. Finally, you can develop fundamental solution elements to push on the high leverage points. If you have correctly identified the root causes, your fundamental solutions will probably work, though fine tuning is almost always necessary.
The Two Key Equations - Why exactly do superficial solution work only partially, temporarily, or not at all? It's because the Superficial Solution Forces can never be greater than the Root Cause Forces. The diagram shows this law of physics with S < R. The equation means "S is always less than R." By contrast, Fundamental Solution Forces work because F > R, meaning "Fundamental solutions can succeed because they can be designed such that F > R." Note how diagram arrow thickness also shows these laws.
These two equation, S < R and F > R, epitomize how activists need to think in order to solve the very difficult social problems we face today. The two equations form the Second and Third Laws of Root Cause Analysis.
Mode Change - Social Force Diagrams contain a powerful feature: They describe how mode change occurs. Once the Root Causes Forces are resolved, the system undergoes a rapid mode change to its new state of natural behavior (its new homeostasis). The result is the New Root Cause Forces. The system now “wants” to be in the desired mode, just as much as it “wanted” to be in the undesired mode before.
System modes exists due to systemic forces. Here systemic means “originating from the system in such a manner as to affect the behavior of most or all social agents of certain types, as opposed to originating from individual agents.” (Harich, 2010) A mode is a continued pattern of behavior. Mode lock-in (also called homeostasis, dynamic equilibrium, policy resistance, and organizational change resistance) occurs when a system’s feedback loops work together to hold the system into a particular mode via compensating feedback. The stronger the lock-in, the stronger the automatic resistance to mode change. Examples of lock-in are thermostats, the guidance system in a missile, and the many self-regulating behaviors of living systems like cells, species, and ecosystems.
All difficult social problems strongly resist superficial solution efforts due to strong mode lock-in, because a social problem is a living system. Thus, lock-in to an undesired mode occurs in all difficult systemic social problems.
The central role of lock-in in the environmental sustainability problem has long been noted, such as by Garrett Hardin in The Tragedy of the Commons, 1968:
Each man is locked into a system that compels him to increase his herd without limit—in a world that is limited.
Simple Example - The My Car Won't Start Problem

Suppose you have the problem of “My car won’t start.” Root cause analysis works by asking “WHY does this occur?” until you find the root causes.
Root cause analysis always starts with a problem’s symptoms, such as My car won’t start. I turn the key and all I hear is a click. WHY is that? You turn the key and you hear a click, but the engine won’t turn over.
Therefore, the cause must be a dead battery. That’s really the intermediate cause. But you assume it’s the root cause and decide to fix the battery. You then either buy a new battery or recharge the old one. Now the car runs. Problem solved.
But superficial solutions only solve a problem partially or temporarily. Two days later the car won’t start again. WHY is that? You have no idea, because replacing or recharging the battery is all you know how to do. The key point of Social Force Diagrams is that if it’s a difficult problem, the fundamental layer is normally hard to see. Without the right tool all you can see is what’s on the superficial layer.
In this problem the fundamental layer is easy to see with the right tool: a volt meter. A friend shows up with a tool you don’t have: a volt meter. She jump starts your car by hooking up your battery to hers. Then, while the car is running, she checks how many volts are charging the battery. Not enough! So the real cause must be a defective alternator, so the battery is not charged enough. That’s the root cause. Now the high leverage point is obvious: fix the alternator, such as by have a mechanic replace the alternator. Now the problem is permanently solved, at least due to that root cause.
Each of us uses some form of root cause analysis every day to solve causal problems. But we usually don't use root cause analysis terms and a formal problem solving process using a tool. This works fine on easy problems. But when we apply the same intuitive approach to more difficult problems, it almost always fails. That's why tools like Social Force Diagrams are required for difficult causal problems.
Retrospective Example - The Autocratic Ruler Problem
The best way to start learning Social Force Diagrams is to study how the tool can be applied to past difficult social problems. Below is one such problem.

One of history’s most intractable problems was autocratic rule by countless warlords, dictators, and kings. The Autocratic Ruler Problem was eventually solved by the invention of modern democracy. This took thousands of years and much painful trial and error because the root cause was unknown.
However, now it is. This allows the retrospective social force diagram shown above to be constructed. The diagram shows at a glance why superficial solutions failed to solve the problem for so long, why the fundamental solution worked, and why, once the mode change occurred, political systems have tended to stay in the new mode due to the right new balancing feedback loop.
Like the other examples, the diagram is simplified. It is not the summary result of full application of the System Improvement Process (SIP), which would involve a social force diagram for each subproblem, a filled in SIP matrix, and simulation models as needed.
Retrospective Example - The Recurring Wars in Europe Problem
Below is a social force diagram for the Recurring Wars in Europe Problem. The diagram shows at a glance why traditional solutions didn’t work. They didn’t resolve the root cause. But after the horrors of two successive world wars on European soil, problem solvers said never again and looked deeper for the root cause. They found it. The resulting solution, the European Union, driven by the Benefits of Cooperation feedback loop, caused a permanent mode change. Today no member of the union would even consider war against an-other member since that would be terribly self-destructive.

The superficial solutions failed because they pushed on a low leverage point. All those peace treaties, military defenses, royal marriages between countries, and so on did nothing to resolve the root cause. The drive to maximize a state’s competitive advantage was a much stronger force than the superficial solutions.
The fundamental solution worked because it pushed on a high leverage point. A high leverage point is connected to a root cause in such a manner that pushing on the high leverage point greatly reduced the root cause force to an acceptable level or eliminates it altogether. This resolves the old root cause forces and creates new root cause forces.
The new root cause forces resulted from careful design of the fundamental solution. Once member states took the first strong step toward tight inter-country coupling, a new reinforcing feedback loop began. The European Union started with market integration and proceeded to further integration (for most members) via a common currency, membership in NATO, military integration, open borders be-tween member states, common policies on agriculture, fisheries, and regional development, etc.
The diagram explains one reason why the United Nations has failed to prevent war between its member states. The United Nations’ work does not push on the high leverage point sufficiently. Another reason is systemic change resistance to solving common good problems.
Current Example - The Money in Politics Problem
A third example is the Money in Politics Problem. The problem has plagued democratic systems ever since they were born, though it has grown more acute in the last several centuries due to the appearance of large for-profit corporations, labeled Corporatis profitis in the diagram.

The symptoms are that political elections and decisions mainly favor powerful special interests, notably large for-profit corporations and the rich. The problem is widely called the corruption or “money in politics” problem, since it’s obvious there’s too much special interest money in politics. If that’s the cause, then the leverage point strategy is also obvious: regulate the undesired behavior. This has been attempted with campaign finance reform, lobbying restrictions, etc.
But serious reform via new laws doesn’t work in most countries, especially large ones like Russia, the United States, and India, for two reasons. First, the foxes are guarding hen house, so they oppose such legislation, causing it to pass in weakened form or not at all. Second, if it is passed, politicians and special interests adapt and find new ways to circumvent the new laws. Continual solution failure indicates there must be a deeper cause of too much special interest money in politics.
If one drills down for that deeper cause, armed with a process like SIP, eventually you will find the root causes. This we have done. Briefly, the main root cause is mutually exclusive goals between Corporatis profitis and Homo sapiens. The goal of Corporatis profitis is maximization of short term profit. The goal of Homo sapiens is optimization of long term quality of life for people, for those living and their descendants. These goals are so mutually exclusive they cannot be achieved in the same system. Currently the corporate life form dominates the human system to such an extent that its goal has become the implicit goal of the system, as demonstrated by system behavior. The inevitable result is the superficial solutions don’t work.
The high leverage point for resolving the root cause is correctness of goals for artificial life forms. A single solution element, Corporation 2.0, has been designed as an example of how to push on the high leverage point.
If problem solvers direct their efforts to fundamental solutions that can resolve the root cause, everything changes. Once the root cause is resolved the system undergoes a mode change, to the new symptoms as shown. All this requires is correct knowledge of the problem’s root causes.
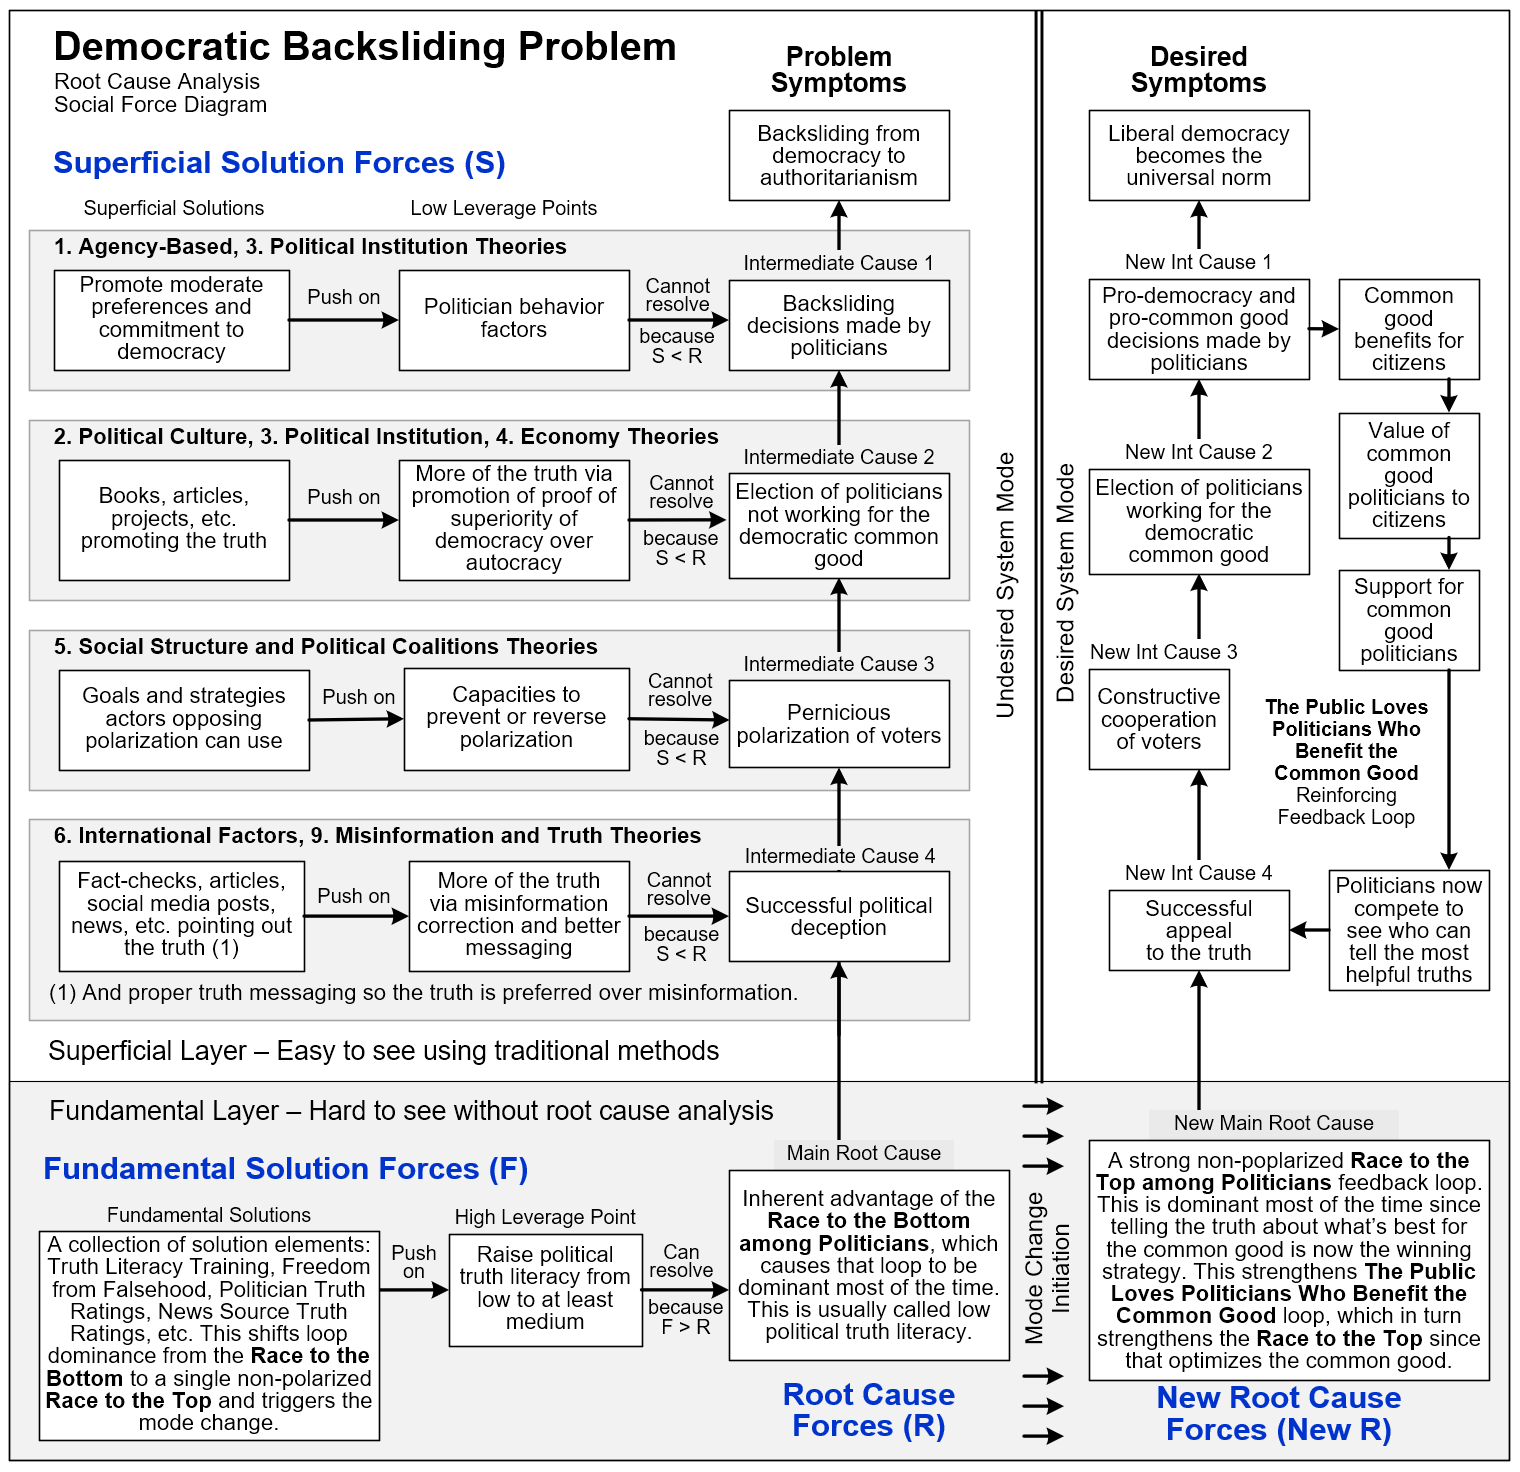
Current Example - The Democratic Backsliding Problem
This is arguably the most important problem in the world today. If it's not solved, the Race to the Bottom Among Politicians will remain the dominant political system loop. The implicit goal of the global human system will tend to be the goals of powerful special interests, which are never the same as common good goals. This will make solving important common good problems like war and climate change impossible.
The Social Force Diagram is explained at length in this paper: Finding and Resolving the Main Root Cause of the Democratic Backsliding Problem.
More Than One Subproblem
The above Social Force Diagrams all have one problem. As a problem grows in complexity it often becomes necessary to use more than one problem, called subproblems. Below are examples from the book Cutting Through Complexity.
The examples show analysis results for applying the System Improvement Process to the global environmental sustainability problem. The first example shows a Social Force Diagram for the unsustainable mode. The second example shows a diagram for the sustainable mode, which occurs after the mode change induced by solution elements implementation.
 First let's look at the summary diagram. This shows the system before the mode change in terms of how the four subproblems, the key feedback loop, and the all-important Main Root Cause.
The diagram summarizes the shape of the larger more complex diagrams. You can see at a glance how the Main Root Cause causes subproblem B. This in turn causes subproblems A and C. Due to the feedback loop, growth in strength of subproblem C increases the strength of subproblem B, which creates the reinforcing feedback loop. This loop causes the problem to spiral out of control quickly, so fast you hardly know what's happening.
For example, that's what's happened in the United States in 2016, with the sudden ascendance of Donald Trump and the Republican Party to control of all three branches of government. The rise to power, and the resulting damage, is unprecedented and severe.
Next let's look at the multi-subproblem Social Force Diagram for the unsustainable mode, shown below. The above diagram has been expanded to show the necessary detail. If you read this diagram slowly you can see the entire analysis, summarized at a high level.

Finally, below is the multi-subproblem Social Force Diagram for the sustainable mode, after the mode change caused by solution elements pushing on the high leverage points.
The important point is that after the mode change occurs, only the solution forces for subproblems B and D are necessary for long-term mode change success.

Miscellaneous Examples
The Messy Apartment Problem SFD, built by William Kurkian as part of the Training Plan, was designed to be a slightly humorous take on a common problem. It's not meant to be fully correct, as that would take much more analysis.
The two fundamental intermediate cause (FIC) nodes are fundamental rather than superficial, because there were no associated solutions that attempted to resolve these intermediate causes. Instead, these nodes were discovered as part of the root cause analysis.
Of considerable interest is the Upscale Bachelor Pad feedback loop diagram and the People Expect... node. The fundamental solutions (FS) cause two changes. One is an increase in Cause People to Visit. The other is an increase in the People Expect... node. This in turn increases the Incentive to Keep It Clean node, which creates the feedback loop.
Overall, this is a fairly sophisticated SFD that illustrates the flexibility and power of the tool. Its strongest feature is diagramming the feedback loop that causes the mode change and keeps the system in the new mode.
Is the feedback loop really fairly permanent and self-managing? That's what a deeper analysis could explore.


